Low-Glycemic Fruits That Are Easier on Blood Sugar
The glycemic index sorts carbohydrate foods into low, medium and high categories by how far and how fast they lift blood glucose. Most whole fruits land low or medium. What usually shifts a fruit from one category to another is not its name but what has been done to it, how ripe it is, and what else is on the plate.
What does a low glycemic index actually mean?
A low glycemic index means a food raises blood glucose slowly and modestly for the amount of carbohydrate it carries, which puts it in the lowest of the three categories used to sort carbohydrate foods. The index is worked out by giving a food to volunteers after an overnight fast, tracking blood glucose over the following hours, and comparing the resulting curve with a reference carbohydrate such as glucose or white bread. Published international tables collect these measured values and group foods into low, medium and high categories 1.
Two things make the index easy to misread. The first is that it describes quality rather than quantity. It tells you how a gram of carbohydrate from a food behaves, not how much carbohydrate you actually ate. Glycemic load is the idea that closes that gap, combining the speed of the rise with the amount of carbohydrate present, which is why a food can sit high on the index and still have a small real-world effect when the food is mostly water.
The second is that any published value is an average taken from a group of tested people. Variety, ripeness, soil, storage, cooking time and even the testing laboratory move the number, which is why the same fruit can appear in more than one category across the international tables. Treat the categories as a rough map, not a label stamped on each piece of fruit.
A low glycemic index is also not the same as low sugar. Avocado and olives sit at the bottom because they contain almost no available carbohydrate at all. Meanwhile a fruit can taste distinctly sweet and still fall in the low category, partly because much of that sweetness comes from fructose, which is handled mainly by the liver and does not lift blood glucose as directly as glucose does.
Which fruits sit in the low category?
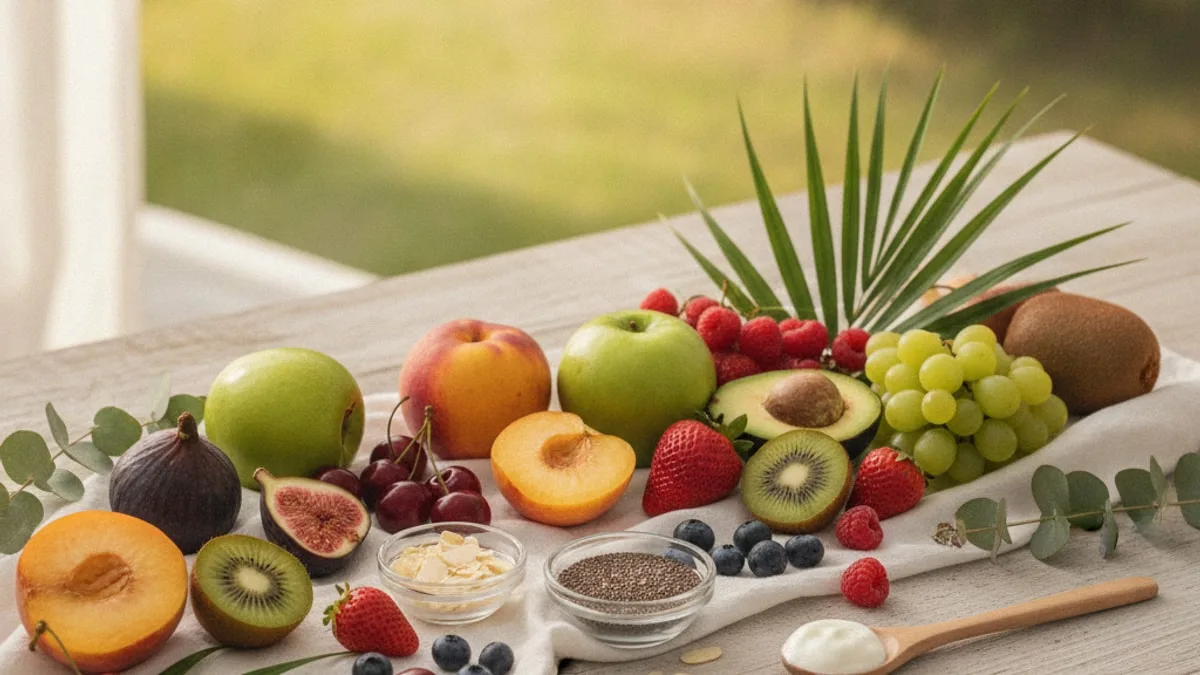
Berries, apples, pears, cherries, plums, peaches, apricots, oranges, grapefruit and kiwi are the fruits that most reliably land in the low category, while ripe bananas, mango, pineapple, papaya and grapes tend to sit in the middle, and melons and most dried fruits sit higher for the carbohydrate they carry. The table below groups fruits by type and describes their usual position in the international tables, along with relative fibre and sugar concentration, using the same low, medium and high categories those tables use.
| Fruit group | Examples | Usual glycemic index category | Fibre content | Sugar concentration |
|---|---|---|---|---|
| Berries | Strawberries, raspberries, blackberries, blueberries | Low | High | Low |
| Pome fruits | Apples, pears | Low | High | Moderate |
| Citrus | Oranges, grapefruit, mandarins | Low | Moderate | Moderate |
| Stone fruits | Cherries, plums, peaches, apricots, nectarines | Low | Moderate | Moderate |
| Firm tropical fruits | Kiwi, guava, passion fruit | Low to medium | High | Moderate |
| Soft tropical fruits | Ripe banana, mango, pineapple, papaya | Medium | Moderate | High |
| Melons | Watermelon, cantaloupe | Medium to high per unit of carbohydrate | Low | Low (mostly water) |
| Grapes and fresh figs | Table grapes, fresh figs | Medium | Moderate | High |
| Dried fruits | Dates, raisins, dried apricots, prunes | Varies widely, apricots and prunes lower, dates higher | High | Very high (concentrated) |
| Fatty fruits | Avocado, olives | Very low | High | Very low |
| Fruit juices | Orange juice, apple juice | Medium to high | Very low | High |
The pattern behind the table is worth more than the rows themselves. Fruits with thick cell walls, a high water content and a decent amount of soluble fibre cluster at the low end. Fruits that are soft, starchy or dried cluster higher. Anything that has been pulped, pressed or dehydrated moves up relative to the fruit it came from, because the processing has already done part of the digestive work.
Where does fasting glucose fit into this?
Fasting glucose is the amount of sugar in your blood after an overnight fast, measured from a routine blood draw, and it is the simplest standard snapshot of how your body handles carbohydrate at rest. Fasting Glucose is the parent guide for this marker, and it covers what the test measures, how it is run, what the standard and optimal ranges are, and how to read a result that sits outside them.
For a fruit question, the useful point is narrower. Fruit eaten during the day does not usually show up in a single fasting reading, because the measurement is taken hours after the last food. What fruit choices influence is the size and shape of the rises in between, and over longer periods those repeated rises form part of the picture that fasting glucose and longer-term markers reflect.
Why does whole fruit behave better than its sugar content suggests?
Whole fruit behaves better than its sugar content suggests because the sugar is locked inside a structure that your digestive system has to dismantle before it can absorb anything. Intact plant cell walls act as a physical barrier. Soluble fibre forms a gel in the stomach and small intestine that slows gastric emptying and the rate at which glucose reaches the bloodstream. Water dilutes the carbohydrate. Chewing takes time, which spreads the eating itself over minutes rather than seconds. Each of these is a small brake, and together they flatten the curve.
Composition matters too. Fruit sugar is a mixture of glucose, fructose and sucrose in proportions that differ by species. Fructose is metabolised mainly in the liver and does not raise blood glucose as directly as glucose does, which is part of why some very sweet fruits still sit in the low category. Fruit also carries polyphenols, including the pigments that make berries dark, and these compounds are being examined for their role in how carbohydrate is absorbed and handled.
The population picture is consistent with the mechanics. Research suggests that higher intake of fruits, vegetables or their fibre is associated with lower risk of type 2 diabetes 2. The relationship is not uniform across fibre sources, though. One analysis comparing cereal fibre with fruit fibre reported that cereal fibre carries the more consistent inverse association with type 2 diabetes, and set out why fruit fibre looks weaker in population data despite its effects on digestion 3. In practical terms, fruit is one contributor among several rather than a single lever.
Is fruit juice the same as the fruit it came from?
No. Juicing removes the structure that slows absorption, leaving sugar in water with most of the fibre and all of the chewing gone. A glass of juice delivers the sugar of several pieces of fruit in under a minute, and the stomach empties it quickly, so the glucose rise is faster and taller than the whole fruit would produce. This is the single biggest difference inside the fruit category, larger than the difference between a berry and a banana.
The long-term data points the same way. Research suggests that higher consumption of sugar-sweetened beverages is associated with a higher incidence of type 2 diabetes, and that fruit juice also shows a positive association, one that weakens once body weight is taken into account 4. A later systematic review and meta-analysis of prospective cohort studies looked specifically at fruit juice and type 2 diabetes risk and found that the association differs depending on the type of juice examined, with sweetened fruit drinks and pure fruit juice behaving differently 5.
Smoothies sit between the two. Blending breaks cell walls but keeps the fibre in the glass, so the sugar is more accessible than in whole fruit yet less exposed than in strained juice. The thicker and more fibrous the blend, and the more of it comes from low-category fruits, the closer it stays to the original. The thinner it is, the more it behaves like juice. If you want the gentlest version of a fruit, eat it in the form it grew in.
What makes berries stand out?
Berries stand out because they combine a low glycemic index with high fibre, high water content and an unusually dense supply of anthocyanins, the pigments responsible for their red, blue and purple colour. Weight for weight they carry less sugar than almost any other sweet fruit, and the seeds and skins add bulk that slows digestion further.
The population data is encouraging. Research suggests that higher dietary intake of anthocyanins and of berry fruits is associated with lower risk of type 2 diabetes 6. Work in people already living with type 2 diabetes points in a similar direction. A meta-analysis of selected whole and powdered fruits found effects on glycemic measures in people with type 2 diabetes, with the direction and size of the effect varying by the fruit studied 7.
Frozen plain berries keep the structure and the pigments. Berry juice, berry syrup and sweetened dried berries do not behave the same way, because sugar has been added or the water has been taken out. The fruit is the thing being described, not the flavour.
Does choosing lower-glycemic fruit change long-term risk?
Fruit choice is one input into long-term metabolic risk, not the deciding one, and the honest framing is that overall dietary pattern, body composition, sleep and activity carry more weight than whether you picked an apple or a mango. That said, the direction of the data on fruit as a food group is favourable. Research suggests that higher intake of fruits, vegetables or their fibre is associated with lower risk of type 2 diabetes 2, and that higher intake of berry fruits and the anthocyanins they contain is associated with lower risk as well 6.
Group averages describe what happens across thousands of people over years. They do not tell you what your own glucose does after a bowl of grapes on a Tuesday afternoon, which is why personal measurement adds something that published categories cannot.
Why does the same fruit hit harder on some days than others?
The same fruit produces different responses because ripeness, processing, temperature, variety and context all change how quickly its carbohydrate becomes available. Ripeness is the clearest example. As a banana ripens, resistant starch converts to simple sugars, the flesh softens and the glycemic response climbs. A firm, slightly green banana and a heavily speckled one are effectively two different foods from a blood sugar point of view.
Processing moves things in the same direction. Mashing, pureeing, pressing and prolonged cooking all break down structure in advance, so digestion starts further along. Canned fruit in syrup adds free sugar on top of fruit that has already been softened. Peeling removes some of the fibre, though the effect is smaller than most people expect, because much of a fruit's soluble fibre sits in the flesh rather than the skin.
Variety matters more than it gets credit for. Different apple cultivars and different grape varieties carry different sugar profiles and different fibre content, which is part of why published values for a single named fruit vary across the international tables.
Finally, context. The same fruit eaten alone on an empty stomach produces a sharper rise than the same fruit eaten at the end of a mixed meal. Recent activity, sleep quality, stress and time of day all shift how efficiently muscle takes up glucose, so an identical food can produce different curves in the same person on different days.
Do dried fruits belong in a lower-glycemic approach?
Dried fruits are concentrated versions of the fruit they came from, so the sugar per bite is much higher, but the glycemic category varies a lot between them rather than being uniformly high. Dried apricots and prunes tend to sit lower, while dates sit higher, and the international tables show this spread clearly 1. Drying removes water, not fibre, so the fibre comes along in concentrated form too, which is why dried fruit does not behave quite like plain sugar.
They are also not nutritionally equivalent to fresh fruit in reverse. Research on nuts and dried fruits has examined their place in the diet of people with type 2 diabetes and describes favourable effects on metabolic measures 8. The practical complication is that dried fruit is easy to eat quickly and easy to keep eating, because the bulk and water that would normally signal fullness have been removed.
Two details are worth checking on the packet. Some dried fruit has added sugar or fruit juice concentrate, which changes the picture entirely. And fruit-based bars, rolls and sweetened dried cranberries are usually closer to confectionery than to dried fruit. The ingredient list tells you which one you are holding.
Does what you eat alongside fruit change the response?
Yes. Fruit eaten as part of a mixed meal produces a flatter glucose curve than the same fruit eaten alone, because protein, fat and additional fibre slow gastric emptying and spread absorption over a longer window. This is one of the most reliable ways the category of a food gets softened in real life, and it is why the glycemic index of a single food measured in a fasted laboratory setting is a starting point rather than a prediction.
Fat and protein both slow the stomach's release of its contents into the small intestine. Additional soluble fibre adds viscosity. Acidity, from citrus or vinegar-based dressings, slows gastric emptying as well. None of these cancels the carbohydrate, they change its timing.
Order matters too. Eating the carbohydrate part of a meal after the protein and vegetables generally produces a smaller rise than eating it first. These are structural observations about digestion rather than instructions, and the way they apply to any individual is something to work through with a clinician or a registered dietitian who knows your history.
Are melons, grapes and tropical fruits a problem?
No, they are simply less gentle on blood sugar than berries and apples, and the size of that difference depends heavily on how they are eaten. Watermelon is the classic example of a fruit that looks worse on paper than it behaves. It sits high on the index per unit of carbohydrate, yet it is overwhelmingly water, so what reaches the bloodstream from a normal amount of it is modest.
Ripe tropical fruits such as mango, papaya and pineapple sit in the middle category because their flesh is soft, their fibre is less structural and their sugar is readily accessible. Grapes are small, easy to eat without pausing, and have skin that offers little resistance. None of this makes them foods to avoid.
The sensible framing is relative, not binary. If blood sugar control is a priority, the low-category fruits are a reasonable default and the medium-category fruits are a change of pace rather than a mistake. In people with diagnosed glucose problems, the specifics belong in a conversation with the clinician managing their care, because the right approach depends on the whole clinical picture rather than on a fruit list.
Why do two people react differently to the same fruit?
Glycemic responses vary substantially between individuals because insulin sensitivity, muscle mass, gut microbial composition, recent physical activity, sleep and the speed of gastric emptying all differ from person to person. Two people can eat an identical apple and produce visibly different curves, and the same person can produce different curves on different days.
Insulin sensitivity is the dominant factor. When muscle tissue takes up glucose readily, a given carbohydrate load passes through with a smaller and shorter rise. When uptake is sluggish, the same load lingers. Physical activity in the hours before and after eating changes this measurably, because contracting muscle pulls glucose from the blood through a pathway that does not depend entirely on insulin.
Digestive speed is the second factor. How fast the stomach empties sets the pace at which sugar arrives in the small intestine, and that varies with meal composition, body position, stress and individual physiology. Gut microbial communities differ enormously between people and influence fermentation of fibre further down the tract.
The practical consequence is that published categories tell you where to start, not where you will land. If you want to know how a specific fruit behaves for you, the answer comes from your own measurements rather than from a table, and from reading those measurements alongside the rest of your bloodwork rather than in isolation.
How can you see what fruit is doing to your own numbers?
You see it through blood testing, with fasting glucose as the routine starting point and longer-term markers filling in what a single morning reading cannot show. A fasting result is an observation, not a diagnosis. A value drifting toward the top of the standard range may reflect reduced insulin sensitivity, poor sleep, illness, recent weight change or several other things at once, and what it means for you is a conversation for a clinician.
| Marker | Typical lab reference range | FitScript optimal range |
|---|---|---|
| Fasting glucose | 65 to 99 mg/dL | 75 to 86 mg/dL |
Typical lab reference ranges vary by laboratory, age and sex, and the range printed on your own report is the one that applies to your sample. The optimal range shown is FitScript's optimization target, not a diagnostic cut-off.
Several markers are worth looking at alongside it. HbA1c reflects average glucose exposure over the preceding months and smooths out single-day noise. Fasting insulin shows how much insulin your body is producing to hold that glucose level, which can shift long before glucose does. Triglycerides and HDL cholesterol often move together with insulin resistance. An oral glucose tolerance test shows the response to a carbohydrate load rather than the resting state. Ferritin is one of several additional tests a clinician may consider depending on the wider picture. FitScript's membership covers 150+ biomarkers tested per year, with results interpreted by Atlas, its AI health advisor, and any treatment decisions belonging to a licensed provider.
When is it worth talking to a clinician?
It is worth talking to a clinician whenever a glucose result sits outside your laboratory's standard range, whenever a result that was previously normal has moved noticeably, or whenever symptoms appear alongside the number. Persistent thirst, needing to urinate more often than usual, unexplained weight loss, dark-coloured urine, blurred vision, recurring infections, slow-healing cuts or unusual fatigue are all reasons to arrange a review rather than wait for the next scheduled test. A result that is well outside the standard range is worth discussing with a clinician promptly.
The sequence is always the same. Note the observation, consider what it may reflect, and take it to someone qualified to interpret it in the context of your history, medications, family background and everything else on your panel. A single value never carries a diagnosis on its own, and no food choice substitutes for that assessment. Treatment decisions belong to a licensed provider.
This page is educational and is not medical advice. Discuss your own results and any treatment with a clinician or licensed provider before changing anything.
Key takeaways
- Berries, apples, pears, cherries, plums and citrus are the fruits that most consistently fall in the low glycemic category, while soft tropical fruits, grapes and most dried fruits sit higher.
- A low glycemic index describes how fast carbohydrate becomes available, not how much sugar a food contains, and the two often disagree.
- Fibre, water, intact cell walls and chewing are the brakes that make whole fruit gentler than its sugar content suggests.
- The largest difference inside the fruit category is between whole fruit and juice, not between one whole fruit and another.
- Ripeness, processing, variety and what else is on the plate can move a single fruit between categories.
- Individual responses vary, so your own bloodwork, read alongside the rest of your panel, tells you more than any published list.
References
- International tables of glycemic index and glycemic load values 2021: a systematic review. The American Journal of Clinical Nutrition, 2021.
- Higher intake of fruits, vegetables or their fiber reduces the risk of type 2 diabetes: A meta-analysis. Journal of Diabetes Investigation, 2016.
- Cereal fiber, fruit fiber, and type 2 diabetes: Explaining the paradox. Journal of Diabetes and Its Complications, 2018.
- Consumption of sugar sweetened beverages, artificially sweetened beverages, and fruit juice and incidence of type 2 diabetes: systematic review, meta-analysis, and estimation of population attributable fraction. British Journal of Sports Medicine, 2016.
- Consumption of Fruit Juice and Risk of Type 2 Diabetes Mellitus: A Systematic Review and Meta-Analysis of Prospective Cohort Studies. The American Journal of Medicine, 2025.
- Associations of dietary intakes of anthocyanins and berry fruits with risk of type 2 diabetes mellitus: a systematic review and meta-analysis of prospective cohort studies. European Journal of Clinical Nutrition, 2016.
- A meta-analysis of available data of the effects of selected whole and powdered fruits on glycemia in type 2 diabetes. The American Journal of Medicine, 2026.
- Nuts and Dried Fruits: An Update of Their Beneficial Effects on Type 2 Diabetes. Nutrients, 2017.
Common questions
Which fruits have the least sugar?
Avocado and olives contain almost no sugar at all, and among sweet fruits, raspberries, blackberries and strawberries carry the least for their weight. Lemons, limes and grapefruit are also low. Dates, raisins and other dried fruits are at the opposite end, because removing the water concentrates the sugar.
Is a low GI fruit always a low sugar fruit?
No. The glycemic index describes how quickly a food's carbohydrate reaches the bloodstream, while sugar content describes how much is there. A sweet fruit can sit in the low category because its sugar is locked inside fibre and cell walls, and a fruit with modest sugar can sit higher because that sugar is easy to release.
Does blending fruit change how it affects blood sugar?
Blending breaks the cell walls that normally slow digestion, so the sugar becomes more accessible than it was in the whole fruit. The fibre stays in the glass, which is why a thick smoothie behaves more gently than strained juice. The thinner the blend, the closer it gets to juice.
Can someone with prediabetes still eat fruit?
Whole fruit is generally not off limits, and the lower-glycemic fruits are a reasonable default. The right approach depends on the full clinical picture, including other conditions, medications and lab results, so this is a question for the clinician managing your care rather than one a general guide can answer.
Is 100 percent fruit juice better than soda?
Pure juice brings vitamins and polyphenols that soda does not, but it delivers sugar in liquid form without the fibre and structure that slow absorption in whole fruit. From a blood sugar point of view it behaves much more like a sweet drink than like the fruit it was pressed from.
Does ripeness change how a banana affects blood sugar?
Yes, noticeably. A firm, slightly green banana contains more resistant starch, which digests slowly. As it ripens, that starch converts to simple sugars and the flesh softens, so a heavily speckled banana produces a faster and larger rise than the same banana would have a week earlier.
Which tests show how my body handles carbohydrate?
Fasting glucose is the routine starting point, and HbA1c reflects average glucose exposure over the preceding months. Fasting insulin can show changes that glucose has not yet picked up, and triglycerides and HDL cholesterol add context. A clinician decides which combination makes sense for you and what the results mean together.
Should I stop eating fruit to lower my fasting glucose?
Cutting out fruit is rarely the first thing worth changing, and a fasting reading is taken hours after the last food, so it reflects far more than what you ate the previous day. Bring the result to a clinician, who can look at it alongside your other markers and history before anything changes.