AFib on an ECG: What It Looks Like and Other Tests
Sudden face droop, arm weakness, trouble speaking, or chest pain means call 911 now, before anything else.
The sections below walk through what the tracing actually shows, why a short recording can miss the rhythm entirely, what longer monitors and wearable alerts add, and which blood tests usually get run at the same time.
What does the rhythm look like on a 12-lead tracing?
On a 12-lead tracing, atrial fibrillation appears as an irregularly irregular ventricular rhythm with no distinct, repeating P waves, usually with a wavy baseline where those P waves should be.
A normal sinus beat starts in the sinus node, spreads across both atria as one organized wave, and prints a small, consistent P wave before every QRS complex. The interval from one R wave to the next stays steady, give or take the small swing that comes with breathing. In atrial fibrillation that order is gone. Atrial tissue depolarizes in many places at once, so instead of one P wave the tracing shows rapid, low amplitude undulations called fibrillatory waves. Sometimes they are coarse enough to spot easily in lead V1, and sometimes they are so fine that the baseline simply looks slightly fuzzy.
The second clue is the spacing. The atrioventricular node receives a chaotic stream of impulses and lets them through unpredictably, so the R to R intervals vary from beat to beat with no repeating pattern. Clinicians call this irregularly irregular, and on paper it is the most recognizable feature of all.
The QRS complexes themselves usually stay narrow, because once an impulse clears the AV node it travels down the normal conduction system. Rate is not part of the picture. The ventricular rate can be fast, normal or slow depending on how readily the AV node conducts, which is why this rhythm can print at 70 beats per minute just as easily as at 150.
The 2023 ACC/AHA/ACCP/HRS atrial fibrillation guideline describes the diagnosis as resting on ECG documentation of irregular R to R intervals together with absent distinct repeating P waves 1.
| What to look at | What it looks like | What it may reflect |
|---|---|---|
| P waves | Absent, or replaced by rapid irregular undulations | The atria are not producing one organized depolarization |
| Baseline between QRS complexes | Fine or coarse fibrillatory waves varying in size and timing | Disorganized atrial electrical activity |
| R to R intervals | Irregular with no repeating pattern | Unpredictable conduction through the AV node |
| QRS width | Usually narrow unless a separate conduction delay exists | The ventricles are being activated through the normal pathway |
| Ventricular rate | Slow, normal or fast, and variable beat to beat | How many atrial impulses the AV node allows through |
Why do the P waves disappear?
The P waves disappear because a P wave is only the printed record of one organized atrial contraction, and in this rhythm that organized contraction is not happening.
In sinus rhythm, a single impulse leaves the sinus node and sweeps across both atria like a wave across a pond. The ECG electrodes record that coordinated movement as one small, reproducible deflection. In atrial fibrillation, multiple shifting wavelets circulate through atrial tissue at once, each one depolarizing a small region at a slightly different moment. The electrical activity never cancels into a single clean vector, so what reaches the paper is a constantly changing jitter rather than a repeating shape.
Two practical consequences follow. First, the atria quiver instead of squeezing, so the small top up of blood that a normal atrial contraction pushes into the ventricle just before each beat is lost. People sometimes notice this as reduced exercise tolerance before they notice anything about their pulse. Second, blood moves more sluggishly inside the atria, which is why stroke risk assessment is a standard part of guideline care once the rhythm is documented.
The AV node explains the irregularity of the pulse. It acts as a gate, and because it is bombarded with impulses arriving at random moments, some arrive while the gate is still recovering and are blocked, while others get through. The result at the wrist and on the tracing is the same, beats that never settle into a rhythm you can tap along with.
How can you tell this apart from other irregular rhythms?
You tell them apart by asking two questions of the tracing, whether organized atrial activity is visible before the QRS complexes, and whether the irregularity has a pattern.
- Atrial flutter. The atria still depolarize in an organized loop, so the baseline shows repeating sawtooth flutter waves rather than random fibrillatory jitter. The ventricular response is often regular, because the AV node conducts in a fixed ratio, though variable conduction can make it look irregular at a glance.
- Premature atrial or ventricular beats. The underlying rhythm is regular with visible P waves, interrupted by early beats. The irregularity is intermittent rather than continuous, and the pattern usually repeats.
- Sinus arrhythmia. P waves are present and normal in shape, and the rate speeds slightly with inhalation and slows with exhalation. The variation is gentle and cyclical.
- Multifocal atrial tachycardia. P waves are present but take at least three different shapes, and the rhythm is irregular. The presence of identifiable P waves is the distinguishing feature.
- Sinus tachycardia. Fast, but regular, with a clear P wave before every complex.
This is one of the reasons a clinician reads the tracing rather than relying on the machine print out at the top of the page. Automated interpretation can mislabel coarse fibrillatory waves as P waves, or call frequent premature beats fibrillation. A rhythm strip over several seconds, read by a human, settles most of these questions.
How long does the rhythm have to be recorded to count?
The rhythm has to be captured on an actual tracing, and for single lead recordings the usual threshold is at least 30 seconds of continuous rhythm, or a full 12-lead tracing showing it 1.
That rule exists because short bursts of irregular activity are common and not always meaningful. A few seconds of noise on a wearable, or a handful of premature beats, is not the same thing as sustained fibrillation. Requiring a continuous window gives the person reading the tracing enough beats to confirm that P waves are genuinely absent and that the irregularity has no pattern. A viewpoint on the 2024 European Society of Cardiology atrial fibrillation guidance similarly frames documented ECG confirmation as the foundation of both diagnosis and everything that follows 2.
There is a separate category worth knowing about. Implanted and wearable devices sometimes record brief fast atrial episodes in people who have no symptoms at all, often described as subclinical atrial fibrillation. Research suggests that digital tools are increasingly used to surface these episodes in people who would not otherwise be tested, which is exactly why each flagged episode still needs review against a recorded tracing before anything is concluded 3.
So the honest answer to how long is twofold. Thirty seconds is the usual documentation threshold for a single lead recording, and a clinician decides what a shorter or device flagged episode means in the context of the whole person.
Can a normal ECG rule it out?
No. A normal ECG shows the rhythm during the few seconds it was recording, and nothing more.
Atrial fibrillation frequently comes in episodes that begin and end on their own, which clinicians describe as paroxysmal. Someone can feel a racing, fluttering pulse for twenty minutes in the evening, convert back to sinus rhythm overnight, and produce a textbook normal tracing in a clinic the following morning. A resting 12-lead recording captures roughly ten seconds. The odds of those ten seconds landing inside an episode that happens twice a month are poor.
This is the central argument for longer recording. Research suggests that extended electrocardiographic monitoring reclassifies how an individual rhythm pattern is understood far more reliably than clinical impression alone, including distinguishing episodes that come and go from a rhythm that is continuously present 4.
In day to day practice, the first step is often simpler than a monitor. Checking the pulse at the wrist for irregularity is a long standing opportunistic screen, and in primary care an irregular pulse is a prompt to record a tracing rather than a conclusion on its own 5.
The practical takeaway for anyone with symptoms and a normal tracing is this. A normal result is reassuring about the moment it was taken, it does not close the question, and recurring symptoms are worth raising again with a clinician rather than filing away.
How reliable are single lead and handheld recordings?
Single lead recordings perform well for this specific question when the tracing is clean and a clinician reviews it.
Research suggests that single lead portable electrocardiographic monitoring detects atrial fibrillation with high accuracy when compared against conventional 12-lead recording 6. That matters because single lead devices are easy to use at the moment symptoms appear, which is often precisely when a clinic tracing is unavailable.
The limits are worth understanding too. A single lead sees the heart from one angle, so it is good at answering whether the rhythm is irregular and whether P waves are visible, and poor at everything else a 12-lead shows, including the regional detail used to assess other cardiac questions. Baseline wander, muscle tremor and poor skin contact all degrade the signal, and automated classification of ambulatory recordings has to contend with exactly that kind of noise 7.
The sensible way to use one is as a capture tool rather than an answer. Record during symptoms, save the tracing, and bring the file to the appointment. A recording made at the moment of a racing pulse is far more useful to a clinician than a description from memory, and it lets the rhythm question be settled on actual data.
What do Holter monitors and patch recorders add?
They add time, which is the one thing a clinic tracing cannot provide.
A 12-lead tracing is a snapshot with excellent detail. Ambulatory monitoring trades some of that detail for continuous coverage across ordinary life, including sleep, exercise, stress and meals. That coverage is what allows a symptom diary entry to be matched against the rhythm at that exact minute, which is often the question that actually needs answering. Research suggests that longer ambulatory monitoring characterizes a person's rhythm pattern more accurately than shorter recording or clinical judgement 4, and reviews of ambulatory recording describe the automated analysis that makes multi day datasets readable in the first place 7.
| Recording method | Roughly how long it records | What it is best suited to |
|---|---|---|
| 12-lead ECG in clinic | A few seconds | Detailed look at the rhythm present right now |
| Holter monitor | About a day or two | Daily symptoms, rate behaviour across sleep and activity |
| Adhesive patch recorder | Several days up to a couple of weeks | Less frequent episodes, matching symptoms to rhythm |
| Intermittent event recorder | Weeks | Infrequent symptoms the wearer can trigger a recording for |
| Implanted loop recorder | Months to years | Rare episodes, or unexplained stroke investigation |
Exact wear times depend on the device and on what the clinician orders, so treat the middle column as a general shape rather than a specification. The choice usually follows symptom frequency. Daily symptoms suit a short monitor, monthly symptoms do not.
Does a watch alert mean the rhythm is confirmed?
No. A wearable alert is a prompt to get a confirmatory tracing reviewed by a clinician, not a finding in itself.
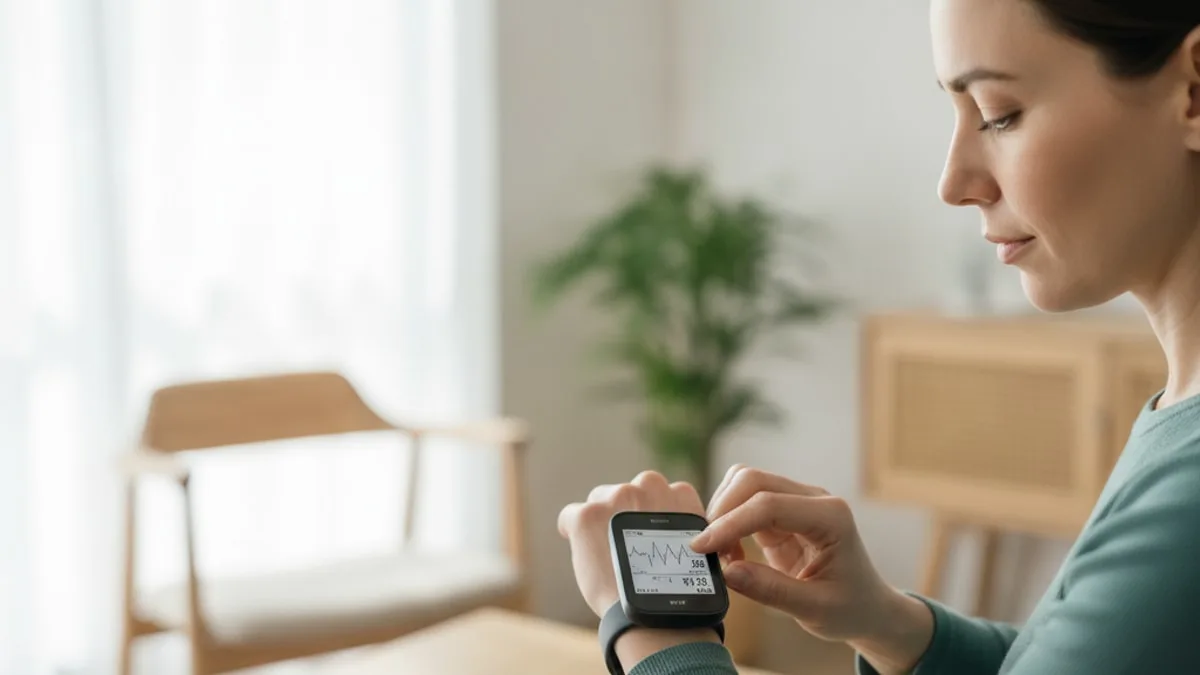
Two different technologies are involved. Most background monitoring uses an optical sensor on the underside of the watch that measures pulse timing through the skin, a method called photoplethysmography. Studies suggest that pulse based optical detection of irregular rhythms has expanded rapidly across consumer devices, with confirmation by an electrical recording remaining the reference step 8. Separately, many watches can record a short single lead electrical tracing when the wearer touches the crown or bezel, which produces something far closer to a clinical rhythm strip.
False alerts happen. Arm movement, cold hands, a loose band, tremor and premature beats can all produce an irregular optical signal, and a notification generated while someone is walking the dog deserves a second look rather than alarm. Research suggests that smartwatch based detection has real promise for surfacing rhythm abnormalities in people not otherwise being monitored, while confirmation and clinical interpretation remain necessary 9.
The useful response to an alert is practical. Export the recording rather than screenshotting the summary, note what you were doing and how you felt, record another tracing if symptoms return, and bring all of it to a clinician. If the alert comes with chest pain, fainting or the stroke signs listed at the top of this page, that is an emergency call, not an appointment request.
Where does thyroid testing fit into a rhythm workup?
Thyroid testing is included because an overactive thyroid can speed the heart and provoke palpitations, so clinicians commonly check it when a rhythm question comes up. TSH is the usual first thyroid marker, and that dedicated guide covers how it is tested and how a result is read. Compare your result with the range printed on your lab report. FitScript's optimal range for TSH is 0.5 to 2 mIU/L, an optimization target rather than a diagnostic cut off. Reference ranges vary by lab, age and sex, and no single value explains a rhythm on its own. A result outside the standard range is worth discussing with a clinician alongside the tracing itself.
Which blood tests usually get run alongside a rhythm workup?
The usual companions are electrolytes, kidney function, a blood count, thyroid markers and basic metabolic measures, because each one can influence heart rate or change what a clinician does next.
Heart muscle cells depend on electrolyte gradients to depolarize and recover, so potassium, magnesium, sodium and calcium are checked routinely when rhythm is in question. Kidney function shapes how those electrolytes are handled and informs later care decisions. A complete blood count catches anemia, which can push the resting heart rate up and make palpitations more noticeable. Glucose and HbA1c sit in the same metabolic picture as blood pressure and body composition. High sensitivity CRP is sometimes added as a general inflammation marker and is read in context rather than alone.
| Test | Why it is often checked alongside a rhythm tracing |
|---|---|
| Potassium and magnesium | Electrolyte shifts change how heart cells conduct and recover |
| Sodium and calcium | Complete the electrolyte picture |
| Creatinine and estimated GFR | Kidney function affects electrolyte handling and later decisions |
| Complete blood count | Anemia can raise resting heart rate |
| Fasting glucose and HbA1c | Metabolic health sits alongside rhythm and blood pressure |
| High sensitivity CRP | General inflammation marker, interpreted in context |
| Thyroid markers | Thyroid activity influences heart rate |
Typical lab reference ranges for creatinine are shown below.
| Marker | Lab range |
|---|---|
| Creatinine, men | As printed on your lab report |
| Creatinine, women | As printed on your lab report |
These are typical lab reference ranges, and ranges vary by lab, age and sex. Seeing these markers together is more informative than seeing any one of them, which is the logic behind broad panels such as the 150+ biomarkers tested per year in a FitScript membership, where Atlas, the AI health advisor, builds the interpretation and a licensed provider decides what follows.
What else can make a tracing look irregular?
Plenty of things, and most of them are technical rather than cardiac.
Loose or dried out electrodes produce sudden baseline jumps that can mimic chaotic activity. Shivering, essential tremor and tensing the arms add muscle noise that buries small P waves. Movement during the recording causes baseline wander, the slow rolling drift that makes the trace look like it is on water. Incorrect lead placement changes the apparent shape and size of P waves, sometimes making them hard to see when they are actually present. Signal quality of this kind is a known obstacle for automated analysis of ambulatory recordings, which is why algorithms are designed around noisy real world data 7.
Biological causes of irregularity other than fibrillation include frequent premature atrial or ventricular beats, variable conduction in flutter, and the breathing linked variation of sinus arrhythmia. Caffeine, alcohol, poor sleep, fever, dehydration and acute stress can all make the heart beat faster and make normal variation feel more noticeable, without changing the rhythm itself. Some medicines also affect heart rate, and your prescriber is the right person to ask about anything you are taking.
The point is not that an irregular tracing should be dismissed. It is that the interpretation belongs to a clinician who can compare the recording against lead placement, signal quality, symptoms and the rest of the workup before drawing any conclusion.
Who is more likely to turn out to have this rhythm?
Likelihood rises with age, and the rhythm sits closely with blood pressure.
Atrial fibrillation is associated with hypertension, and detection and management of the two overlap enough that each prompts attention to the other 10. Long standing elevated pressure places mechanical strain on the left atrium, and a stretched, remodelled atrium conducts differently from a healthy one.
Because the rhythm is often silent, opportunistic detection matters. In primary care, checking the pulse during routine visits in older adults and following an irregular pulse with a recorded tracing is a long established approach to finding cases that symptoms alone would miss 5. Digital tools have widened that net further, surfacing episodes in people who feel entirely well and who would not have been tested otherwise 3.
When a rhythm question comes up, clinicians commonly ask about blood pressure control, alcohol intake, sleep quality and snoring, body weight, exercise habits, thyroid history and family history. None of those questions diagnoses anything. They shape which tests are ordered and which parts of the picture get attention first. In people with high blood pressure in particular, rhythm and pressure are usually managed as one conversation rather than two 10.
What usually happens after the rhythm is documented?
Once a tracing documents the rhythm, the clinician moves from detection to assessment, and every decision from there belongs to them.
The assessment typically covers how severe the symptoms are, how long episodes last and how often they occur, what the ventricular rate does at rest and with activity, blood pressure control, and an estimate of stroke risk using a structured scoring approach. An echocardiogram is often arranged to look at heart structure and valve function. Blood work fills in thyroid, kidney, electrolyte and metabolic context.
The 2023 ACC/AHA/ACCP/HRS guideline frames care as a combination of risk factor modification, stroke risk management and a decision about rate versus rhythm strategy, chosen with the individual rather than applied uniformly 1. A viewpoint on the 2024 European Society of Cardiology guidance describes a similarly structured pathway built around the same pillars 2.
This page does not go into what any specific intervention involves, because treatment decisions belong to a licensed provider who has reviewed the person in front of them. What is useful to know as a reader is the shape of the process. Confirm the rhythm on a tracing, quantify the burden, assess risk, address the drivers that can be addressed, and review again. If you are already under care, the most useful thing you can bring to the next appointment is dated recordings and a short symptom log.
When is it worth talking to a clinician?
Immediately for emergency signs, promptly for new or worsening symptoms, and at the next available appointment for intermittent palpitations that keep returning.
Call 911 for sudden face droop, arm or leg weakness, trouble speaking or understanding speech, sudden severe headache, sudden vision loss, chest pain or pressure, severe breathlessness, or fainting. These need emergency assessment, and no home recording should delay that call.
Contact a clinician promptly, rather than waiting, for a pulse that stays unusually fast or irregular at rest, new breathlessness on exertion that was not there before, chest tightness with activity, light headedness, swelling in the legs, or a wearable alert that keeps repeating. A result or a tracing outside the usual pattern is worth discussing with a clinician promptly rather than monitored silently at home.
Book a routine appointment for occasional fluttering or skipped beats without other symptoms, especially alongside a family history of rhythm problems or known high blood pressure. Bring any saved recordings, a note of when episodes happen and what you were doing, your blood pressure readings if you track them, and recent lab results.
This article is educational and is not medical advice. Discuss your tracings, your results and any treatment with a clinician or licensed provider who knows your history.
Key takeaways
- Atrial fibrillation on a tracing means no distinct repeating P waves, irregularly irregular R to R intervals, and often a wavy fibrillatory baseline.
- Rate is not part of the picture, the rhythm can print slow, normal or fast.
- A normal clinic tracing only describes the seconds it recorded, so it does not rule out episodes that come and go.
- Single lead and wearable recordings are useful capture tools, and a clinician still reviews the tracing before anything is concluded.
- Longer monitoring is what matches symptoms to rhythm, with the recording length chosen to fit how often episodes happen.
- Thyroid, electrolyte, kidney, blood count and metabolic markers are commonly checked alongside the rhythm question.
- Emergency signs come before everything else, call 911 rather than recording a tracing first.
For more on the sensations that usually prompt a tracing in the first place, see the guide to afib symptoms. If a fast heart rate arrives with fever, agitation and confusion, read about thyroid storm symptoms, which is an emergency. For a broader look at why the heart can feel like it is racing, thumping or skipping, see heart palpitations causes.
References
- 2023 ACC/AHA/ACCP/HRS Guideline for the Diagnosis and Management of Atrial Fibrillation: A Report of the American College of Cardiology/American Heart Association Joint Committee on Clinical Practice Guidelines. Circulation, 2024.
- The 2024 European Society of Cardiology Guidelines for Diagnosis and Management of Atrial Fibrillation: A Viewpoint from a Practicing Clinician's Perspective. Thrombosis and Haemostasis, 2024.
- Digital health solutions in the screening of subclinical atrial fibrillation. Herz, 2021.
- Differentiating paroxysmal from persistent atrial fibrillation: long-term electrocardiographic monitoring is mightier than the clinician. Journal of the American College of Cardiology, 2014.
- Screening and management of atrial fibrillation in primary care. BMJ, 2021.
- Atrial fibrillation detection using single lead portable electrocardiographic monitoring: a systematic review and meta-analysis. BMJ Open, 2018.
- A Review on Atrial Fibrillation Detection From Ambulatory ECG. IEEE Transactions on Bio-medical Engineering, 2024.
- Photoplethysmography based atrial fibrillation detection: a continually growing field. Physiological Measurement, 2024.
- Smart watch applications in atrial fibrillation detection: Current state and future directions. Journal of Cardiovascular Electrophysiology, 2024.
- Atrial Fibrillation Detection and Management in Hypertension. Hypertension, 2023.
Common questions
What does atrial fibrillation look like on an ECG?
It looks like a rhythm with no clear, repeating P waves before the QRS complexes, usually with a fine or coarse wavy baseline in their place. The spacing between beats is irregular with no repeating pattern, which clinicians describe as irregularly irregular. The QRS complexes themselves are usually narrow, and the heart rate can be slow, normal or fast.
Can an ECG be completely normal in someone who gets this rhythm?
Yes. A resting tracing records only a few seconds, so if the rhythm comes and goes it can easily be absent at the moment of the test. A normal result describes that moment and does not close the question. If symptoms keep returning, say so at the next appointment, because longer monitoring may be the better tool.
How long does a recording need to last for the rhythm to be documented?
For a single lead recording, the usual threshold is at least 30 seconds of continuous rhythm, and a standard 12-lead tracing showing the rhythm also counts. Shorter bursts or device flagged episodes are reviewed by a clinician rather than taken at face value. The person reading the tracing needs enough beats to confirm that P waves are truly absent.
Is a smartwatch recording good enough to confirm the rhythm?
A watch alert or recording is a prompt to seek review, not a confirmation. Export the tracing rather than a screenshot, note what you were doing and how you felt, and bring it to a clinician who can read it alongside your history. If the alert comes with chest pain, fainting or stroke signs, call 911 instead of waiting for an appointment.
How is atrial flutter different from fibrillation on a tracing?
Flutter still produces organized atrial activity, so the baseline shows repeating sawtooth waves rather than random jitter, and the ventricular rhythm is often regular. Fibrillation produces no organized atrial waveform and an irregular ventricular rhythm with no pattern. The two can look similar at a glance, which is one reason a clinician reads the strip rather than relying on the machine label.
Do I need to prepare for an ECG?
Very little preparation is needed. Wear something easy to open at the chest, skip heavy lotions or oils on the skin that day since they interfere with electrode contact, and try to sit still and relaxed during the recording because movement and shivering add noise. Tell the technician if you have a tremor, and mention anything you take so your clinician has the full picture.
Why would a clinician order thyroid and electrolyte tests after an abnormal tracing?
Because thyroid activity and electrolyte balance both influence how fast the heart beats and how heart cells conduct electrical signals. Checking them helps the clinician understand what else may be contributing before deciding on next steps. These results are read together with the tracing and your symptoms, never as a standalone answer.
When is an irregular heartbeat an emergency?
Call 911 for sudden face droop, arm or leg weakness, trouble speaking, sudden severe headache, sudden vision loss, chest pain or pressure, severe breathlessness, or fainting. Contact a clinician promptly, without waiting for a routine slot, for a pulse that stays fast or irregular at rest, new breathlessness on exertion, light headedness, or leg swelling. Occasional flutters without other symptoms can be raised at a regular appointment.